Getting Started with Open Telemetry
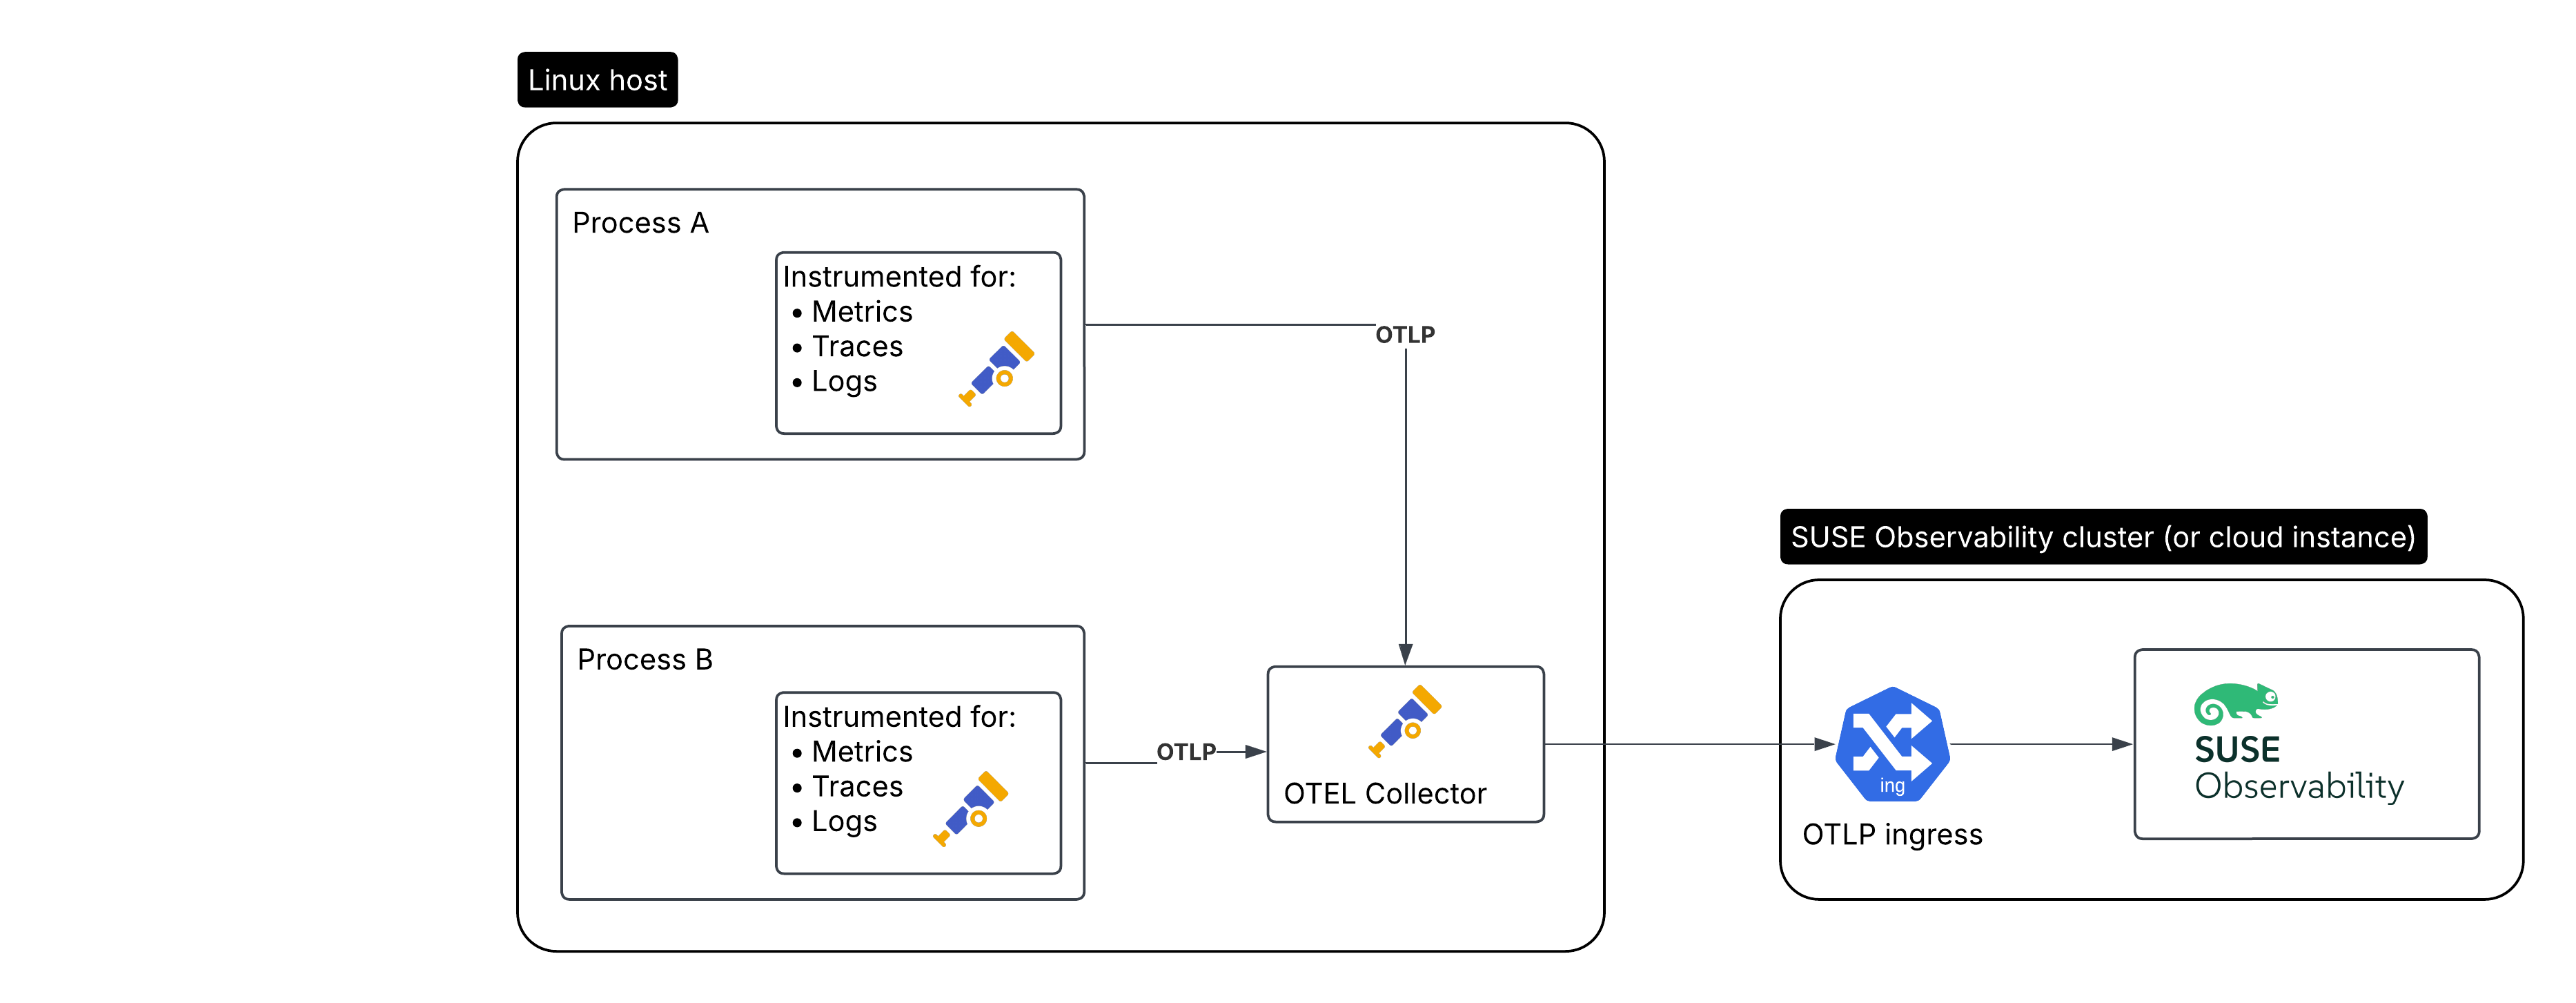
Here is the setup we’ll be creating, for an application that needs to be monitored:
-
The monitored application / workload running on a Linux host
-
The Open Telemetry collector running on the same Linux host
-
SUSE Observability or SUSE Cloud Observability
Install the Open Telemetry collector
|
For a production setup it is strongly recommended to install the collector, since it allows your service to offload data quickly and the collector can take care of additional handling like retries, batching, encryption or even sensitive data filtering. |
First we’ll install the collector. We configure it to:
-
Receive data from, potentially many, instrumented applications
-
Enrich collected data with host attributes
-
Generate metrics for traces
-
Forward the data to SUSE Observability, including authentication using the API key
Next to that it will also retry sending data when there are a connection problems.
Install and configure the collector
The collector provides packages (apk, deb and rpm) for most Linux versions and architectures and it uses systemd for automatic service configuration. To install it find the latest release on Github and update the URL in the example to use the latest version:
-
DEB AMD64
-
DEB ARM64
-
RPM AMD64
-
RPM ARM64
wget https://github.com/open-telemetry/opentelemetry-collector-releases/releases/download/v0.123.1/otelcol-contrib_0.123.1_linux_amd64.deb
sudo dpkg -i otelcol-contrib_0.123.1_linux_amd64.deb
wget https://github.com/open-telemetry/opentelemetry-collector-releases/releases/download/v0.123.1/otelcol-contrib_0.123.1_linux_arm64.deb
sudo dpkg -i otelcol-contrib_0.123.1_linux_arm64.debwget https://github.com/open-telemetry/opentelemetry-collector-releases/releases/download/v0.123.1/otelcol-contrib_0.123.1_linux_amd64.rpm
sudo rpm -iv1 otelcol-contrib_0.123.1_linux_amd64.rpmwget https://github.com/open-telemetry/opentelemetry-collector-releases/releases/download/v0.123.1/otelcol-contrib_0.123.1_linux_arm64.rpm
sudo rpm -iv1 otelcol-contrib_0.123.1_linux_arm64.rpmFor other installation options use the Open Telemetry instructions.
After installation modify the collector configuration by editing /etc/otelcol-contrib/config.yaml. Change the file such that it looks like the config.yaml example here, replace <otlp-suse-observability-endpoint:port> with your OTLP endpoint (see OTLP API for your endpoint) and insert your receiver api key for <receiver-api-key> (see here where to find it):
receivers:
  otlp:
    protocols:
      # Only bind to localhost to keep the collector secure, see https://github.com/open-telemetry/opentelemetry-collector/blob/main/docs/security-best-practices.md#safeguards-against-denial-of-service-attacks
      grpc:
        endpoint: 127.0.0.1:4317
      http:
        endpoint: 127.0.0.1:4318
  # Collect own metrics
  prometheus:
    config:
      scrape_configs:
      - job_name: 'otel-collector'
        scrape_interval: 10s
        static_configs:
        - targets: ['0.0.0.0:8888']
extensions:
  health_check: {}
  pprof:
    endpoint: 0.0.0.0:1777
  zpages:
    endpoint: 0.0.0.0:55679
  # Use the API key from the env for authentication
  bearertokenauth:
    scheme: SUSEObservability
    token: "<receiver-api-key>"
exporters:
  nop: {}
  debug: {}
  otlp/suse-observability:
    compression: snappy
    auth:
      authenticator: bearertokenauth
    # Put in your own otlp endpoint, for example suse-observability.my.company.com:443
    endpoint: <otlp-suse-observability-endpoint:port>
processors:
  memory_limiter:
    check_interval: 5s
    limit_percentage: 80
    spike_limit_percentage: 25
  batch: {}
  # Optionally include resource information from the system running the collector
  resourcedetection/system:
    detectors: [env, system] # Replace system with gcp, ec2, azure when running in cloud environments
    system:
      hostname_sources: ["os"]
connectors:
  # Generate metrics for spans
  spanmetrics:
    metrics_expiration: 5m
    namespace: otel_span
service:
  extensions: [ bearertokenauth, health_check, pprof, zpages ]
  pipelines:
    traces:
      receivers: [otlp]
      processors: [memory_limiter, resourcedetection/system, batch]
      exporters: [debug, spanmetrics, otlp/suse-observability]
    metrics:
      receivers: [otlp, spanmetrics, prometheus]
      processors: [memory_limiter, batch, resourcedetection/system]
      exporters: [debug, otlp/suse-observability]
    logs:
      receivers: [otlp]
      processors: []
      exporters: [nop]
Finally restart the collector:
sudo systemctl restart otelcol-contribTo see the logs of the collector use:
sudo journalctl -u otelcol-contribCollect telemetry data from your application
The common way to collect telemetry data is to instrument your application using the Open Telemetry SDK’s. We’ve documented some quick start guides for a few languages, but there are many more:
No additional configuration is needed for the SDKs, they export to localhost via OTLP or OTLP over HTTP (depending on the supported protocols) by default.
For other languages follow the documentation on opentelemetry.io.
View the results
Go to SUSE Observability and make sure the Open Telemetry Stackpack is installed (via the main menu -> Stackpacks).
After a short while and if your application is processing some traffic you should be able to find it under its service name in the Open Telemetry -> services and service instances overviews. Traces will appear in the trace explorer and in the trace perspective for the service and service instance components. Span metrics and language specific metrics (if available) will become available in the metrics perspective for the components.
Next steps
You can add new charts to components, for example the service or service instance, for your application, by following our guide. It is also possible to create new monitors using the metrics and setup notifications to get notified when your application is not available or having performance issues.